PharmaViz
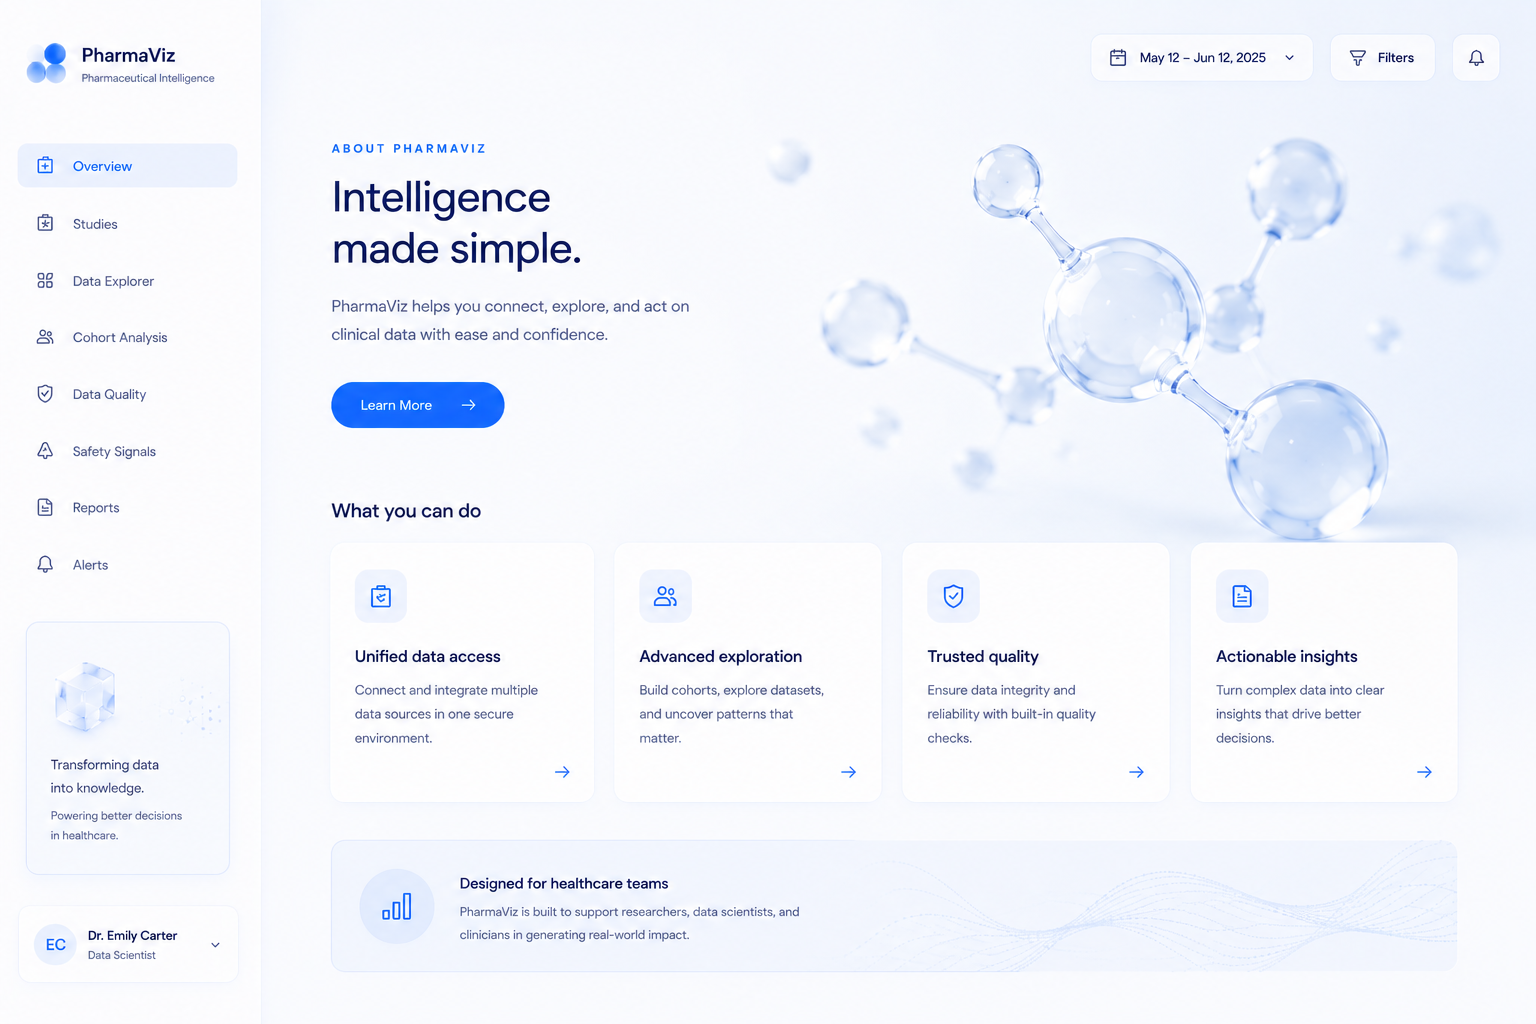
A BI platform that combines sales, stock, and logistics data into one real-time picture.
Where we started
The pharmaceutical company worked with large, multidimensional datasets generated through research, development and clinical trials. Standard BI products and existing charting libraries were either too heavy, too generic or too restrictive for the types of visualisations the company's analysts required. Large datasets also created rendering and performance limitations.
What we did
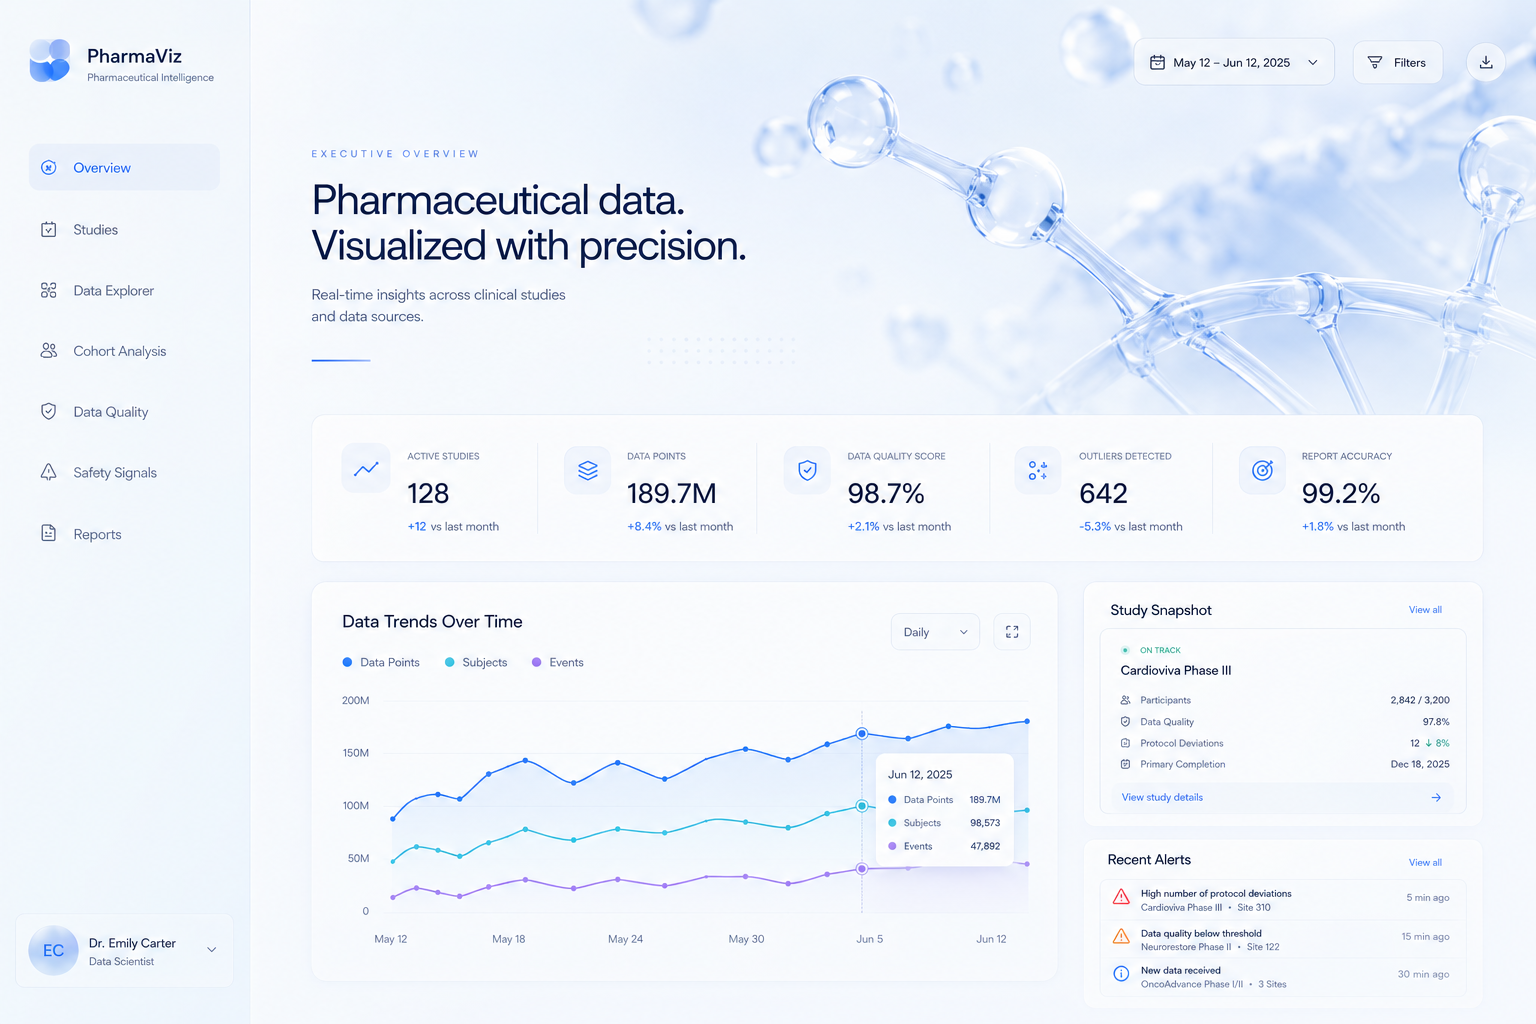
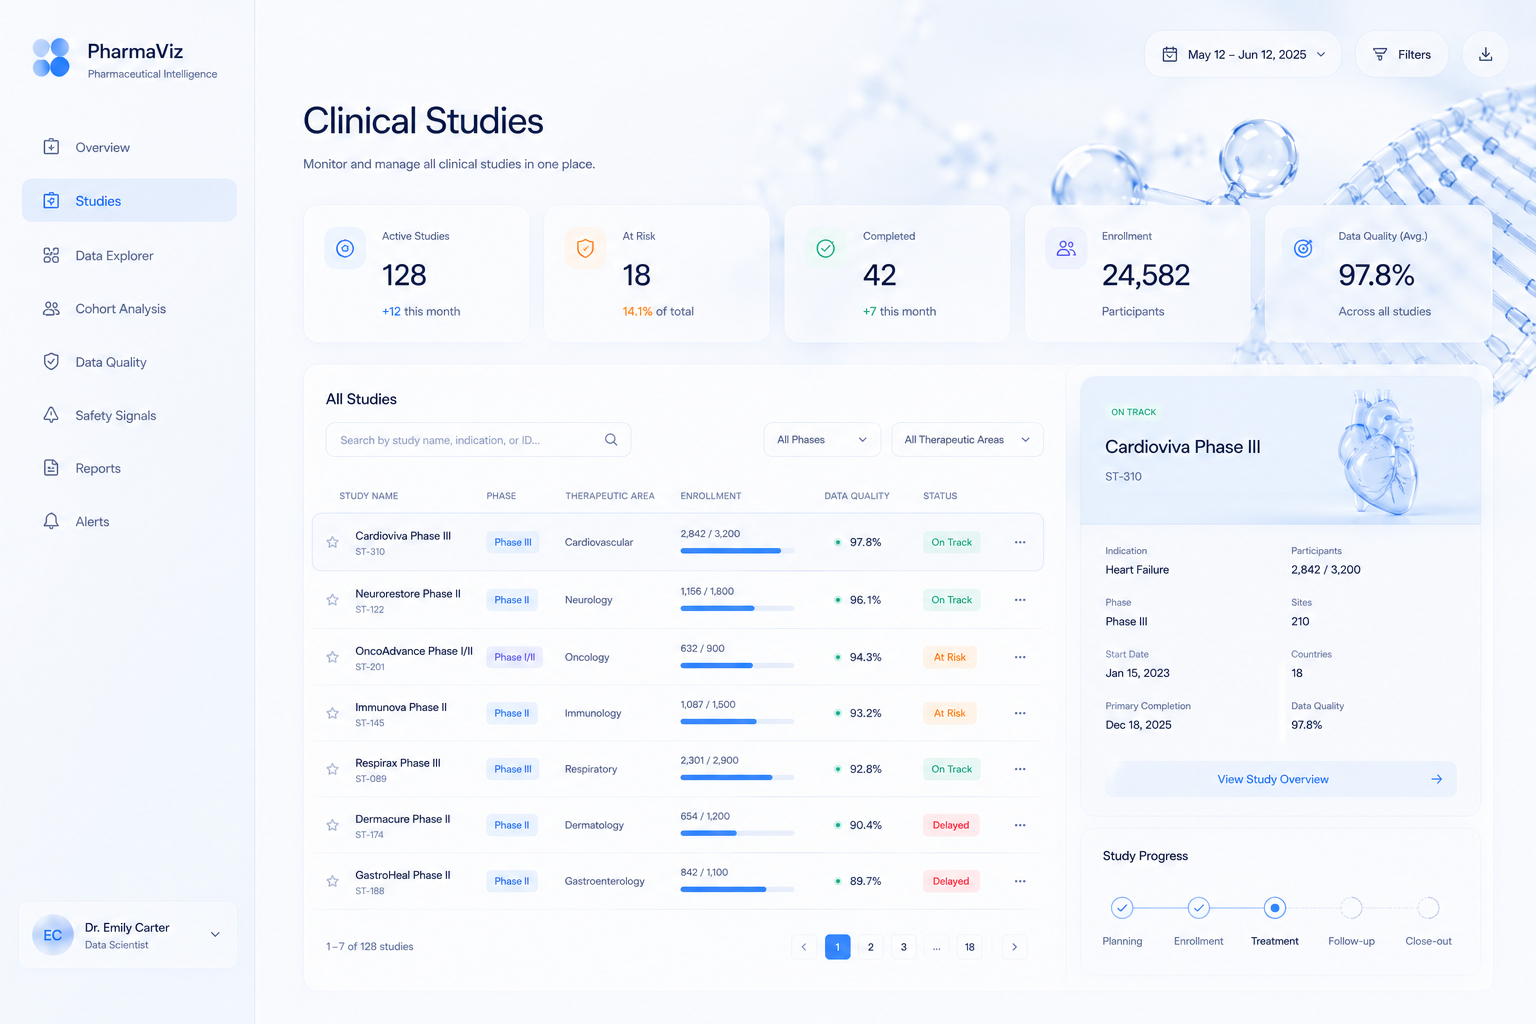
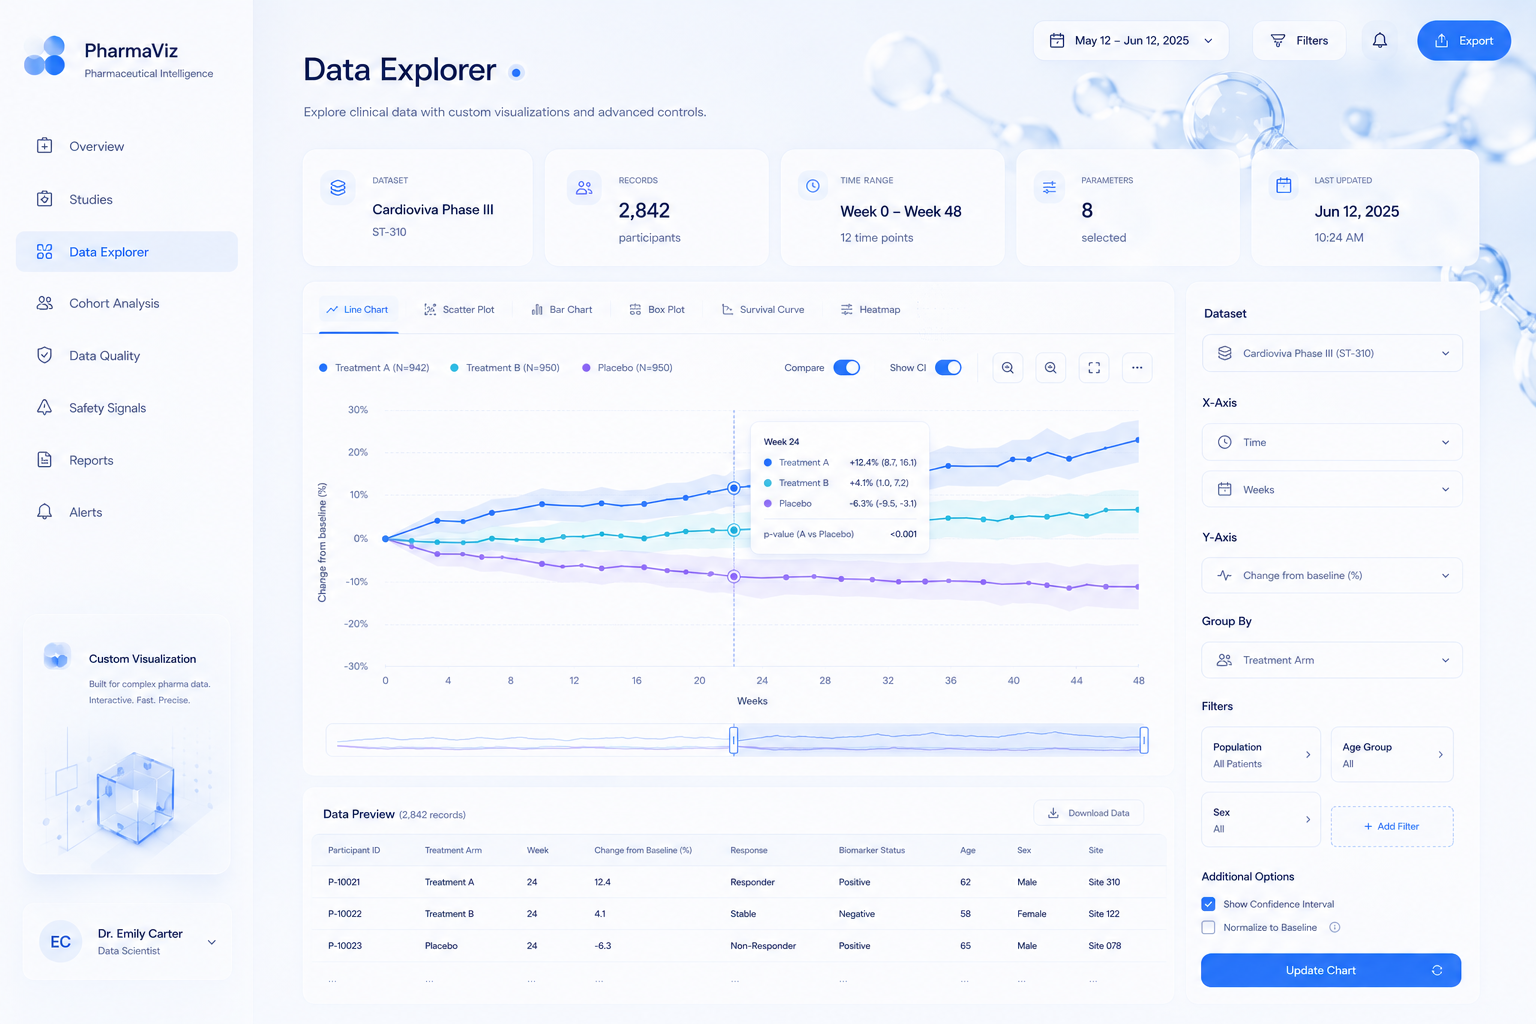
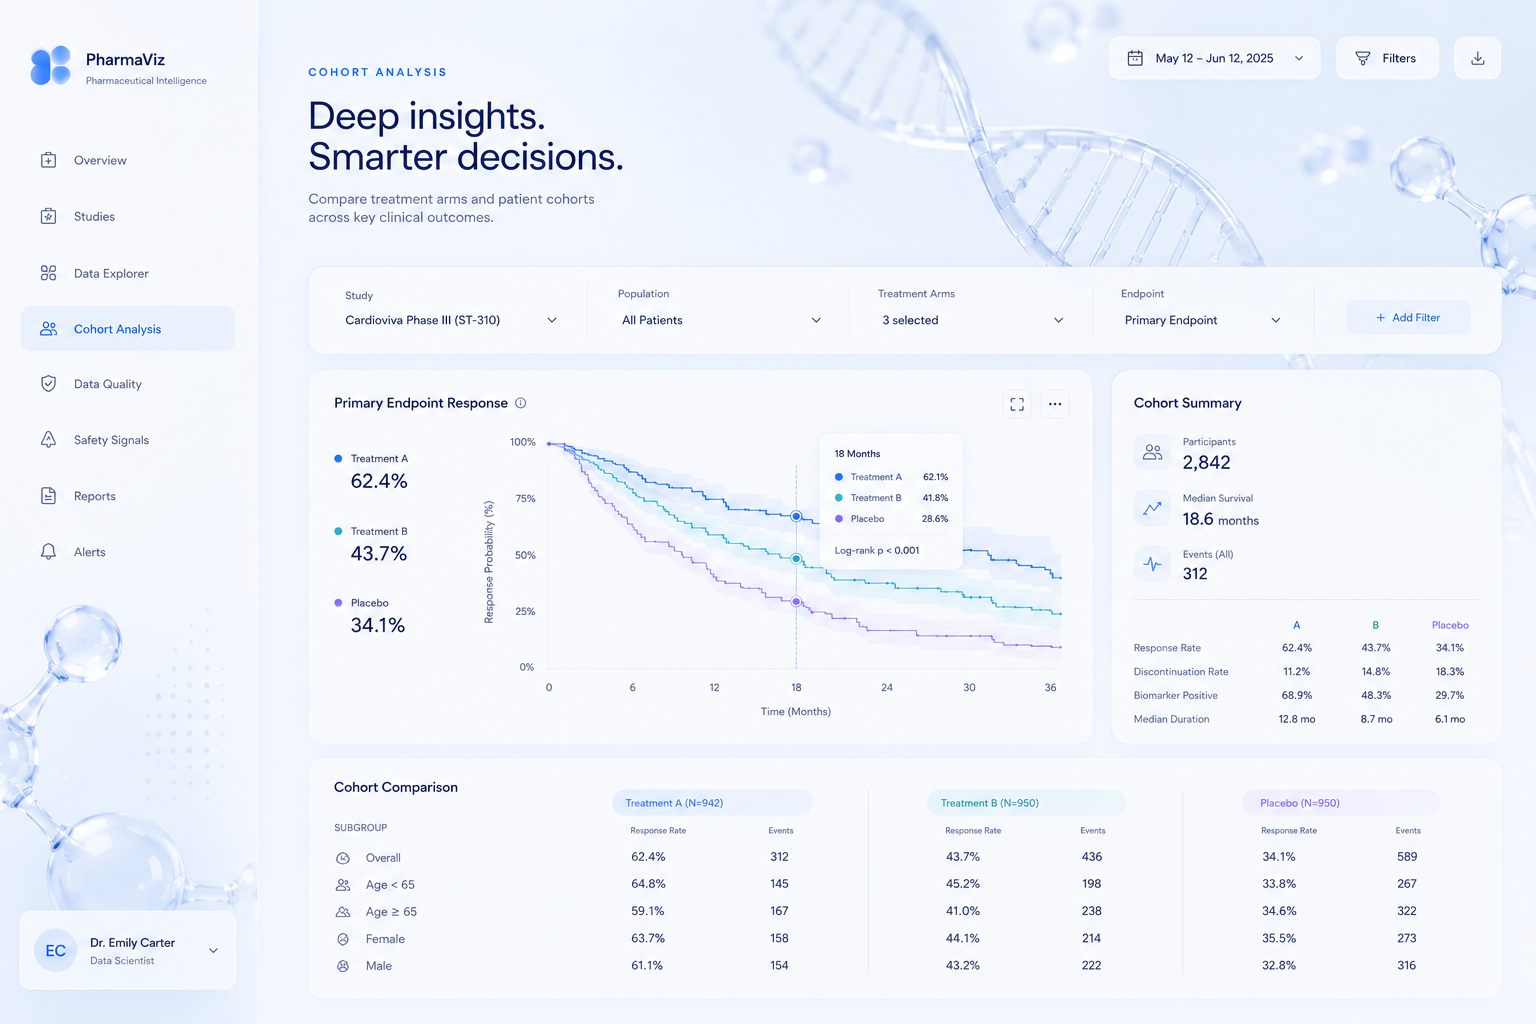
We developed PharmaViz as a dedicated analytics application rather than adapting a generic BI product. A proprietary charting library was created from scratch with custom axes, legends, tooltips, zoom functionality and dynamic interactive elements. The application was designed around a modular visualisation architecture, optimised rendering and an interface capable of presenting highly complex datasets clearly.
What we achieved
The company reduced its dependence on external visualisation libraries and gained much greater control over how pharmaceutical data is presented and analysed. Large datasets could be explored more efficiently, analytical workflows became faster and specialists gained better tools for identifying trends, relationships and anomalies in research data.
What the project looks like
Mockups, key screens, and design fragments.